Check the record before you trust the call
Street Verdict is an education platform for Indian investors. We report what market experts say in public, with the source, check each call against closing prices once its own time frame has ended, and teach you how to read the result: risk, costs, F&O, and how to tell skill from luck.
A record of what people said in public, checked against closing prices. Not investment advice.
Three questions for any call
- 1
Who said it?
Every call names the analyst or firm and links to the article.
- 2
What exactly did they claim?
The quoted words, with any stated target and time frame.
- 3
What happened next?
Closing prices, once the call's own time frame has ended.
See the record
Every call we track comes with its source. Once a call’s time frame has ended, we show how it did, with the sample size and a confidence range.
See graded callsLearn the skills
Interactive lessons on candles, indicators, costs, strategy testing and F&O risk. SEBI’s FY25 study found about 9 in 10 individual F&O traders lost money; the lessons start from there.
Start learningTest ideas on past prices
Try a strategy on prices at least 30 days old and see what it would have returned after charges. No real money, no prizes.
Open Strategy Lab
Track which market analysts are actually right.
We track public calls from Indian market analysts — TV, print, and online — and grade every one HIT or MISS against what actually happened, sourced back to the original article. No spin, no cherry-picking, just the record.
- 1,349
- analysts tracked
- 28,588
- calls logged
- 11,362
- graded HIT or MISS
Market-wide sentiment
Analysts lean bullish
87 analyst stances · last 7 days · one per analyst
Trackable
58 · 58 bull / 0 neutral / 0 bear
Long-Horizon
1 · 1 bull / 0 neutral / 0 bear
Commentary
28 · 26 bull / 0 neutral / 2 bear
“Bullish on Reliance Industries; targets 1,700-1,750 over a two-months-plus horizon. Unlikely to fall below 1,300.”
Latest verdicts
Recently graded calls
“Bearish on Shriram Finance in the short term. Advises watching price action near support at ₹909 for reversal signs. A break below ₹900 would signal further downside, potentially extending towards ₹750. Recommends using a bounce towards the resistance of ₹1,000 as an exit opportunity for long positions, as the correction could extend.”
“Neutral on Nifty, identifying the 22,670–22,690 zone as crucial support and 22,980–23,000 as resistance. A break below the support could expose the index to the next level at 22,500–22,520, indicating a range-bound outlook with potential downside if key support is breached.”
“Bullish on Kotak Mahindra Bank, recommending a buy with a target of ₹485 and a stop loss at ₹445. The stock shows strong bullish momentum with a pole-and-flag breakout, closing at an all-time high with significant volumes and a bullish RSI crossover.”
“Bullish on IGL, recommending a buy at ₹139 with a target of ₹145 and a stop loss at ₹135.”
“Greaves Cotton has seen a sharp recovery, trading above its 50-day moving average (₹200.99) and 200-day EMA (₹196.38), indicating near-term trend improvement. The daily RSI has recovered to 52.63 after approaching oversold levels, suggesting potential for further upside. Investors should consider buying for a target of ₹220, with a stop loss at ₹190.”
“Bullish on IDBI Bank, recommending a buy at ₹80 with a target of ₹85 and a stop loss at ₹78.”
Market Pulse
Live markets, not just predictions.
Real-time NSE/BSE gainers and losers, material stock news, and exchange filings — refreshed every few minutes during market hours.
Gainers
- Apollo Hospitals Enterprise Ltd up 5.29% on Friday1
Apollo Hospitals Enterprise Limited
APOLLOHOSP₹9,200
+5.29%
+₹462
- Axis Bank Ltd rises 4.72% in Friday's session2
Axis Bank Limited
AXISBANK₹1,446
+4.72%
+₹65.2
Unusual volume
- 3
Union Bank of India
UNIONBANK₹218.85
+4.21%
+₹8.85
Unusual volume
- Max Healthcare Institute rises 3.88% in Friday's session4
Max Healthcare Institute Limited
MAXHEALTH₹1,081
+3.88%
+₹40.35
Unusual volume
- 5
Bajaj Holdings & Investment Limited
BAJAJHLDNG₹11,669
+3.16%
+₹357
Losers
- Muthoot Finance falls 2.58% in Friday's session1
Muthoot Finance Limited
MUTHOOTFIN₹2,550.5
-2.58%
-₹67.5
- CG Power and Industrial Solutions down 2.57% on Friday2
CG Power and Industrial Solutions Limited
CGPOWER₹792
-2.57%
-₹20.9
- Vedanta falls 2.32% in Friday's session3
Vedanta Limited
VEDL₹238.04
-2.32%
-₹5.66
Unusual volume
- Siemens Energy India falls 2.19% in Friday's session4
Siemens Energy India Limited
ENRIN₹2,944
-2.19%
-₹66
- E2E Networks, Hitachi Energy India, other AI-related stocks fall up to 5% as AI concerns overshadow Anthropic debut- Moneycontrol.com5
Hitachi Energy India Limited
POWERINDIA₹30,150
-1.95%
-₹600
NIFTY 100 universe
Indian Economy
The macro backdrop, at a glance.
Headline indices, the rupee, and the policy rates and growth projections shaping every call on this page — real data, delayed a few minutes.
Upcoming policy events
RBI Monetary Policy Committee
Next RBI policy decision
04 Dec 2026
Meeting 02 Dec 2026 – 04 Dec 2026 · in 12 days
- Meeting 605 Feb 2027
Official FY2026-27 calendar, announced 23 Mar 2026 under Section 45ZI, RBI Act 1934.
Macro & markets news
View all- Sensex Rejig: Shriram Finance To Enter BSE Index From Dec. 21 As Trent Takes An Exit
NDTV Profit · 5 hours ago
- Trump’s Memecoin Gala Returns With Demand Down and Scrutiny Up
Mint · 5 hours ago
- Stock market outlook: Nifty posts longest weekly winning streak in 5 months; will rally survive next week, Nov 23-27?
Mint · 5 hours ago
- Nifty 50 roars back from 2026 low: 5 big triggers powering market rally
Zee Business · 5 hours ago
Instrument research
Every stock, with the calls on it.
Live price, fundamentals, and every analyst opinion on record — for any NSE-listed stock or index.
RELIANCE
Reliance Industries Limited
₹1,377.5
Market closed · last session · 72h ago+0.14%
HDFCBANK
HDFC Bank Limited
₹846
Market closed · last session · 72h ago+2.94%
TCS
Tata Consultancy Services Limited
₹2,376.2
Market closed · last session · 72h ago+1.43%
SBIN
State Bank of India
₹1,165.1
Market closed · last session · 72h ago+0.79%
Practice
Test ideas on past prices, with real Indian costs.
Run a strategy in the Strategy Lab on prices at least 30 days old and see what it would have made after actual Indian brokerage, STT and exchange charges on every trade, not a simplified sandbox. Learn walks through candles, indicators, costs and strategy testing step by step. No real money, no prizes.
Most strategy-testing tools ignore local cost structure entirely. Ours doesn’t: every trade is charged brokerage, STT, exchange transaction charges, SEBI turnover fee, stamp duty, GST, and DP charges, using the same rate table the Strategy Lab runs.
Open Strategy LabExample: buying 10 shares (delivery) at an example price of ₹1,000. The price is invented for illustration, not a market price.
Charting Workbench
A professional-grade workbench — with your own strategies.
88 drawing tools, 41 indicators, and a technicals gauge that summarises what the indicators read (not advice). Write your own strategy in JavaScript or Python and backtest it, gross AND net of real trading costs, on prices at least 30 days old.
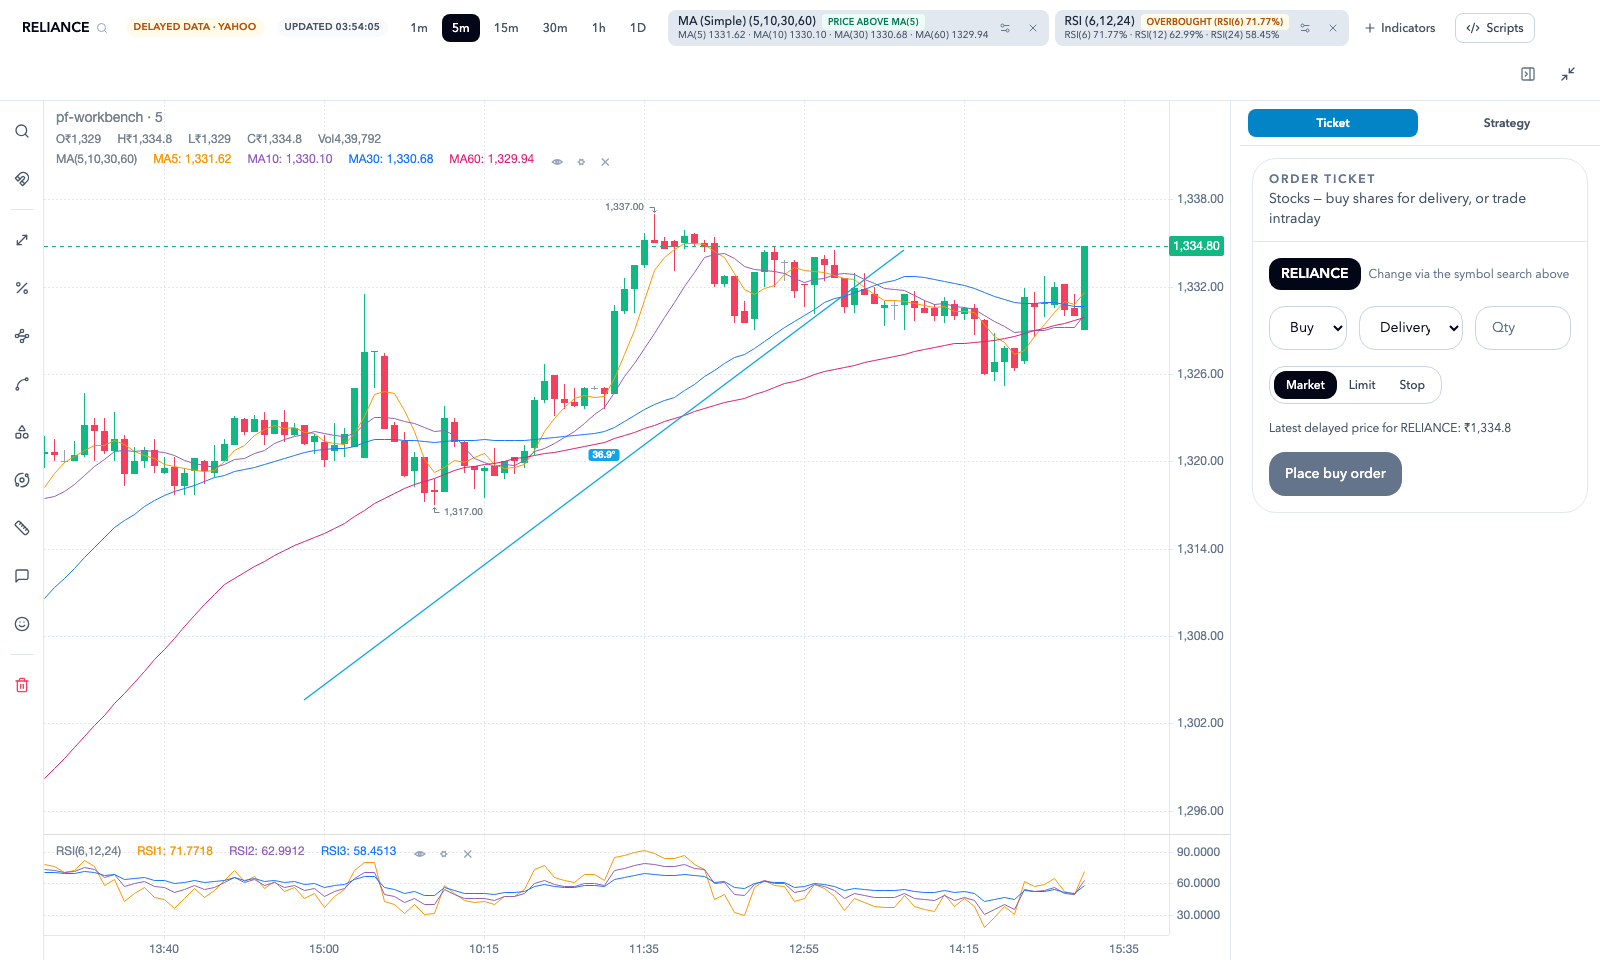
The actual workbench — RELIANCE, live candles with indicators and drawing tools active.
The record
Top analysts by hit rate
Ponmudi R
100%
6 graded calls · 95% CI 61–100% Low sample
Bajaj Broking Analysis
100%
6 graded calls · 95% CI 61–100% Low sample
VLA Ambala
100%
5 graded calls · 95% CI 57–100% Low sample
How it works
Accountability for market punditry.
- 1
We track the calls
Every public prediction an Indian market analyst makes on TV, in print, or online — captured with a link back to the original source.
- 2
We grade them
Once a call's timeframe passes, we check it against real market data and mark it HIT or MISS. No editorializing, no judgment calls.
- 3
You see the record
Every analyst's track record is public — hits and misses both — so you can judge for yourself.